The Joy of Scaling and Random Numbers
There was a number of topics that were taught in Maths lessons when I was at school that were of relevance to Computing, but which are no longer taught. These included number bases (including binary), modular arithmetic and matrices. Perhaps the biggest change, though, is that, whereas we plotted graphs from scratch on paper in a number of subjects, choosing and scaling the axes ourselves, current students are more likely to use a spreadsheet application or draw a graph on pre-printed axes in their GCSE paper. Scaling has therefore become something of a lost art.
Students of Computing will find scaling useful in a number of contexts, including scaling things to fit the screen, creating sets of random numbers and creating web-pages using responsive design.
The Basic Principles
One thing that is still taught in Maths lessons (although currently for Higher-tier students only) is the transformation of graphs of mathematical functions, and there is some similarity between that topic and the first two techniques described here.
Expanding and Compressing Range
The key arithmetic skills for scaling are multiplication and division, and understanding how these expand and compress the range of a set of numbers. For example, if you have a set of numbers in the range 0 to 10, and you want a set of numbers in the range 0 to 100 with the same distribution, you need to multiply by ten. On the other hand, if you have a set of numbers ranging from 0 to 10 and want them to span the range 0 to 5, you need to divide them all by two.
This only works for numbers that start at zero, but you'll find in practice that most – including physical measurements and co-ordinates – do; if they don't then you'll need to shift them as described below.
Proportionality
There might also be other circumstances that require numbers to be reduced or enlarged. Take my Scratch program for drawing a regular polygon, for example. Initially the sprite was moved 100 steps at a time inside the repeat loop, but that meant that the perimeter of the polygon got larger as the number of sides increased. A triangle had a perimeter of 300, a square 400, a pentagon 500, etc., until, if you entered a number greater than ten, the polygon would no longer fit on the screen.
Students do learn about proportionality in Maths – direct and indirect proportion. There is only one variable in the polygon program – the number of sides. To scale the shape to the screen, does the length of the side need to be directly or indirectly proportional to the number of sides? Direct proportion suggests multiplication and indirect proportion suggest division.
In this case, we need the sides to get shorter as their number increases – that's indirect proportion. The way I approached the calculation is to think about the largest polygon that would fit on the screen when the sides had their original length of 100 – a decagon. The decagon has ten sides - I therefore needed to come up with a calculation that used division and the only variable (the number of sides) to give the answer 100. That turned out to be quite simple - as 1000 ÷ 10 = 100 - so the length of the sides needed to be 1000 divided by the number of sides (actually, in the end I preferred the polygon to be slightly smaller, so I went for 950 instead).
Shifting and Offsets
What about if you have a set of numbers from 0 to 10, and you wanted to have a set of numbers that still had a range of 10 but didn't start at zero? Shifting the range of numbers requires addition or subtraction. For example, if we wanted the numbers to range from -5 to 5 instead of 0 to 10, we can subtract five, or if we wanted them to range from 20 to 30 then we can add ten.
We can also use addition and subtraction to shift numbers if we want to expand or compress the range when they don't start from zero – e.g. if your numbers are in the range 10 to 20 and you want them to be in the range 10 to 30, then you can subtract ten, multiply by two, and then add the ten back on.
Drawing a Circle
If you draw a circle, e.g. using sines and cosines (or an equation such as x² + y² = radius²), you can end up with both positive and negative co-ordinates, as both sines and cosines vary in the range -1 to 1 (and square roots can be negative). How you plot these on the screen will vary depending upon the application.
Sometimes (as in home computers of the 1980s) the origin (0,0) is at the bottom-left of the screen, on web-pages it's at the top-left, and in Scratch it's in the middle. This means that if you want to draw a circle centred on the page, you only need to multply by the desired radius in Scratch, but on web-pages and in most programmed environments you also need to add an offset otherwise you'll only see a quarter of the circle at the corner of the screen.
Random Numbers
You can apply the above techniques when scaling random numbers. Most programming languages (and also spreadsheet applications) have a random number function that generates a value between 0 and 1, but we don't often want a number in that range. We might want reproduce the roll of a die, for example, which is an integer in the range 1 to 6. In that case we can multiply by six (to expand the range), convert to an integer to give numbers in the range 0 to 5, and then add one. You can investigate this technique further on my random numbers page.
Random numbers are useful for all sorts of reasons (including making computer-generated things look more realistic), so I include them in the programming section of my KS3 Computing course.
Distribution
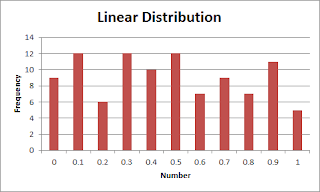
The technique described above will generate a set of random numbers that are uniformly distributed throughout the chosen range - but what happens if that's not what you want?
For my page on estimating angles, I wanted angles to be chosen at random, but for lower numbers to occur more frequently as students encounter smaller angles more often.
To skew the distribution, we can raise the random number to a suitable power. If random numbers are in the range 0 to 1, then squaring or cubing that number, for example, will still give you a number in the range 0 to 1, but the distribution will change. This is because 0² = 0 and 1² = 1, but 0.5² is 0.25 – the distribution is therefore skewed downwards.
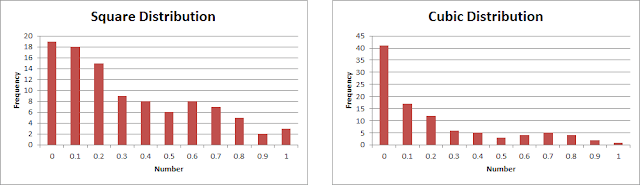
The graphs show the effect of squaring and cubing on the distribution of random numbers. If you want the numbers to be skewed towards the higher end, then raise them to a power and then subtract from 1.
Scaling to Fit the Screen
There is another technique that we can use when scaling things to fit the screen. This is particular useful for things like web-pages, where the range of possible display sizes is large – I use it on my pages for sines and cosines and estimating angles, for example.
If we don’t know how big the screen is going to be, the simplest solution is to calculate the co-ordinates as a percentage or coefficient – e.g. middle of the screen is at 50% or 0.5, and then the final stage is to query the width of the page/screen and then multiply to find the actual co-ordinates.
Web-Pages
Finally, when creating a web-page that can cope with being viewed on screens of different sizes, here are two methods that you can use to create a responsive design.
Firstly, you can use CSS media queries to create different styles depending on, for example, the width of your screen – changing things like font and image sizes or hiding certain elements if there isn't room for them.
Secondly, you can use the new CSS units vh and vw. They are percentages of the viewport height and width respectively, and unlike the old % unit (which only applied to the width of a page or containing element), always applies to the whole browser window and can also be used for font sizes. The viewport is the area of the page visible to the user and usually corresponds to the size of the browser window.
My own web-site, Computing and ICT in a Nutshell, uses a combination of both of these techniques. There are three basic layouts, determined by media queries, which corresponding approximately to PC-, tablet- and phone-sized screens – if you view on a PC and resize the window you'll be able to see what happens.
If the screen is too narrow to have the navigation section on the left, it changes to a menu system at the top, but still with most of the sections (but not Databases because Access is not available on tablets). Shrink the window further and the menu has just two entries to fit the width of a phone screen. The two more compact layouts use relative sizes for text and DIVs – with the vw unit – to scale the menus and headings to fit the available space.
Computing is a very numerate subject, and we mustn't be afraid to teach these mathematical concepts to students. You might, at times, feel like you're teaching Maths, but techniques such as these are essential if your students are to become confident and competent programmers.
This blog originally appeared in the TES Subject Genius series in June 2016.